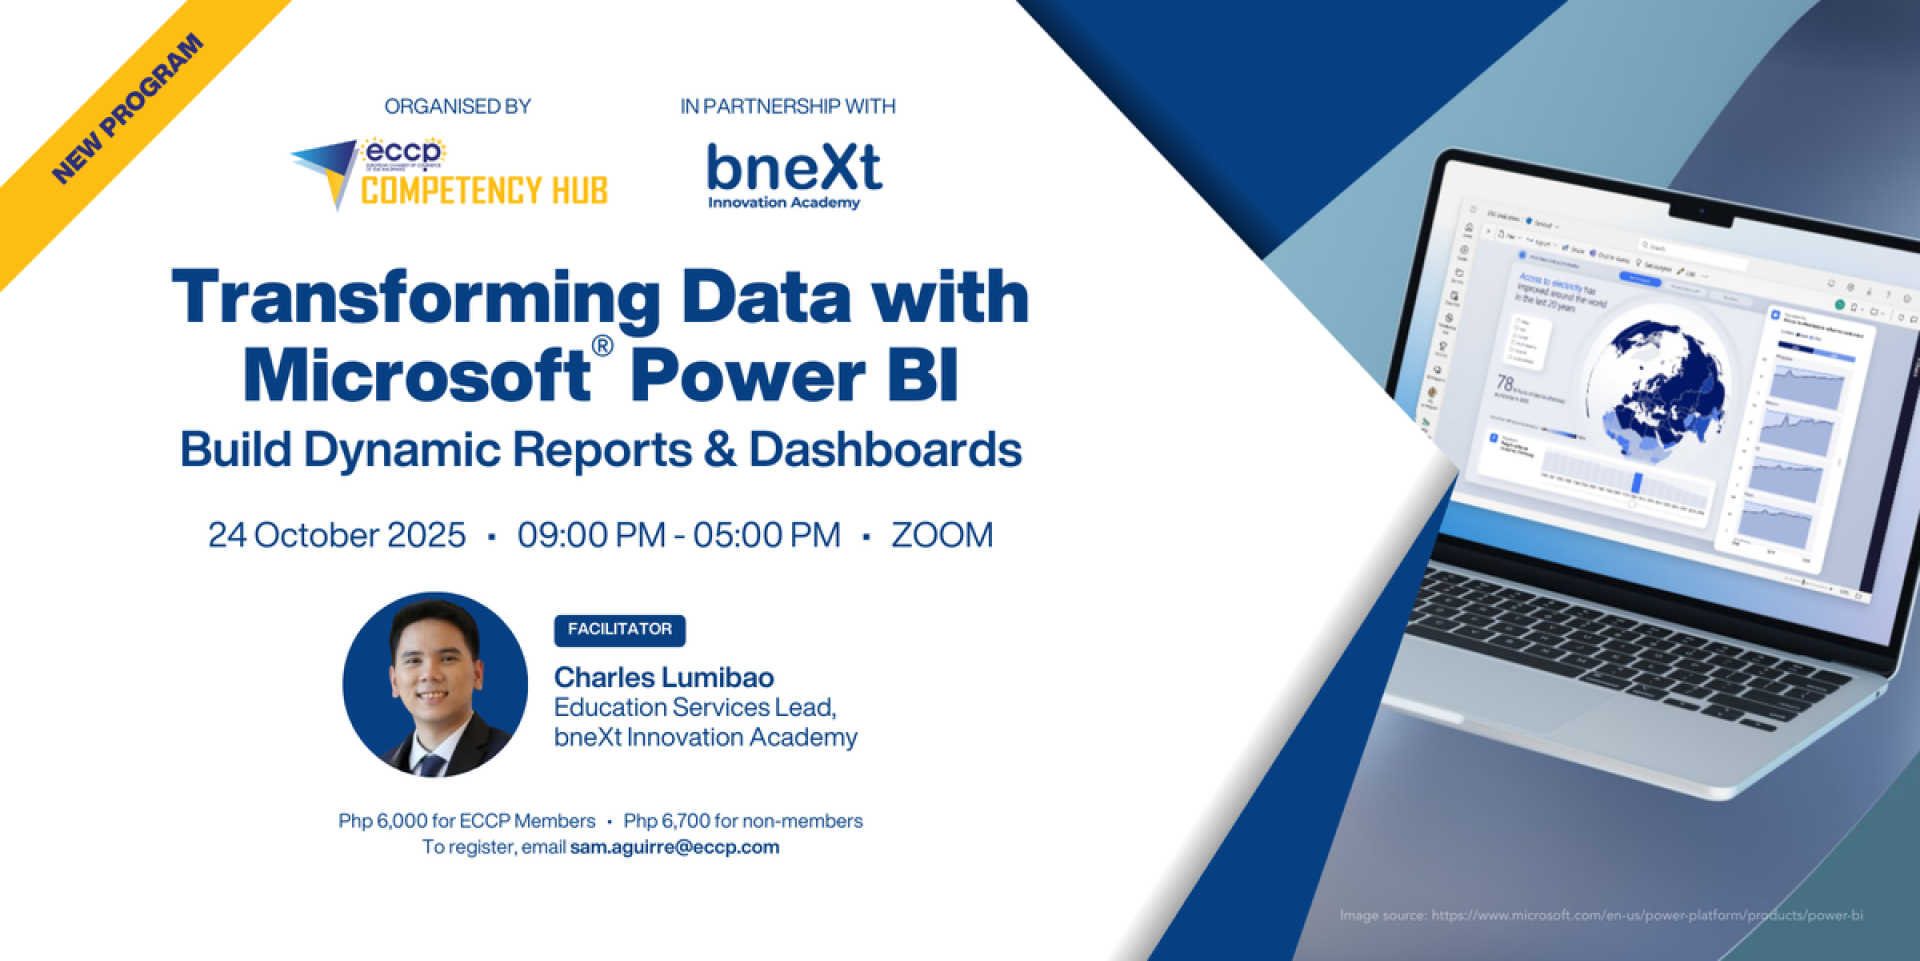
Transforming Data with Microsoft Power BI: Build Dynamic Reports & Dashboards
Course Overview
This course provides a foundational understanding of how to prepare, model, and visualize data using Microsoft Power BI. Participants will learn how to connect to various data sources, clean and transform data using Power Query, build semantic data models, and create compelling reports and dashboards. The course emphasizes hands-on learning and real-world scenarios to help learners turn raw data into actionable insights.
Target Audience Profile
This course is ideal for:
• Business analysts who want to enhance their data storytelling and reporting skills
• Data professionals looking to transition into business intelligence roles
• Excel users seeking to upgrade to more advanced analytics tools
• Managers and decision-makers who need to interpret data insights
• Students and beginners interested in learning Power BI fundamentals
Prerequisites
Before starting this learning path, you should be familiar with data and analytics concepts.
Course Outline
Module 1: Introduction to Power BI
• Understand the Power BI ecosystem
• Learn the flow of data from source to visualization
• What is Power BI?
• Components: Power BI Desktop, Service, Mobile
• Power BI workflow overview
Module 2: Getting Data in Power BI
• Connect to various data sources
• Understand data import vs. DirectQuery
• Connecting to Excel, databases, web, and cloud sources
• Data loading options and performance tips
• Import sample datasets from Excel and SQL
Module 3: Clean, Transform, and Load Data
• Use Power Query to shape and clean data
• Data profiling and column quality
• Changing data types, renaming, removing errors
• Pivoting/unpivoting data
• Merging and appending queries
• Clean a messy dataset using Power Query Editor
Module 4: Design a Semantic Model
• Build a data model that supports analysis
• Relationships and cardinality
• Star schema basics
• Measures vs. calculated columns
• Optimizing model performance
• Create relationships and build a star schema
Module 5: Design Power BI Reports
• Create interactive and insightful reports
• Choosing the right visuals
• Filters, slicers, and drill-through
• Formatting and layout best practices
• Build a report with KPIs, charts, and slicers
Module 6: Get Started with Copilot in Power BI
• Use AI to accelerate report building and analysis
• Natural language queries
• Auto-generating visuals and summaries
• Enhancing productivity with Copilot
• Use Copilot to generate a report from a prompt


